Plot expression of a receptor's ligands by other cell types as a chord plot
Source:R/plot_fxns.R
circos_ligand_receptor.RdCreates a chord plot of expression of ligands that can activate a specified receptor where chord widths correspond to mean ligand expression by the cluster.
Usage
circos_ligand_receptor(
  dom,
  receptor,
  ligand_expression_threshold = 0.01,
  cell_idents = NULL,
  cell_colors = NULL
)
Arguments
- dom
Domino object that has undergone network building with
build_domino()- receptor
Name of a receptor active in at least one cell type in the domino object
- ligand_expression_threshold
Minimum mean expression value of a ligand by a cell type for a chord to be rendered between the cell type and the receptor
- cell_idents
Vector of cell types from cluster assignments in the domino object to be included in the plot.
- cell_colors
Named vector of color names or hex codes where names correspond to the plotted cell types and values to the colors.
See also
Assorted Plotting Functions:
cor_scatter(),
plot_differential_linkages()
Examples
example(build_domino, echo = FALSE)
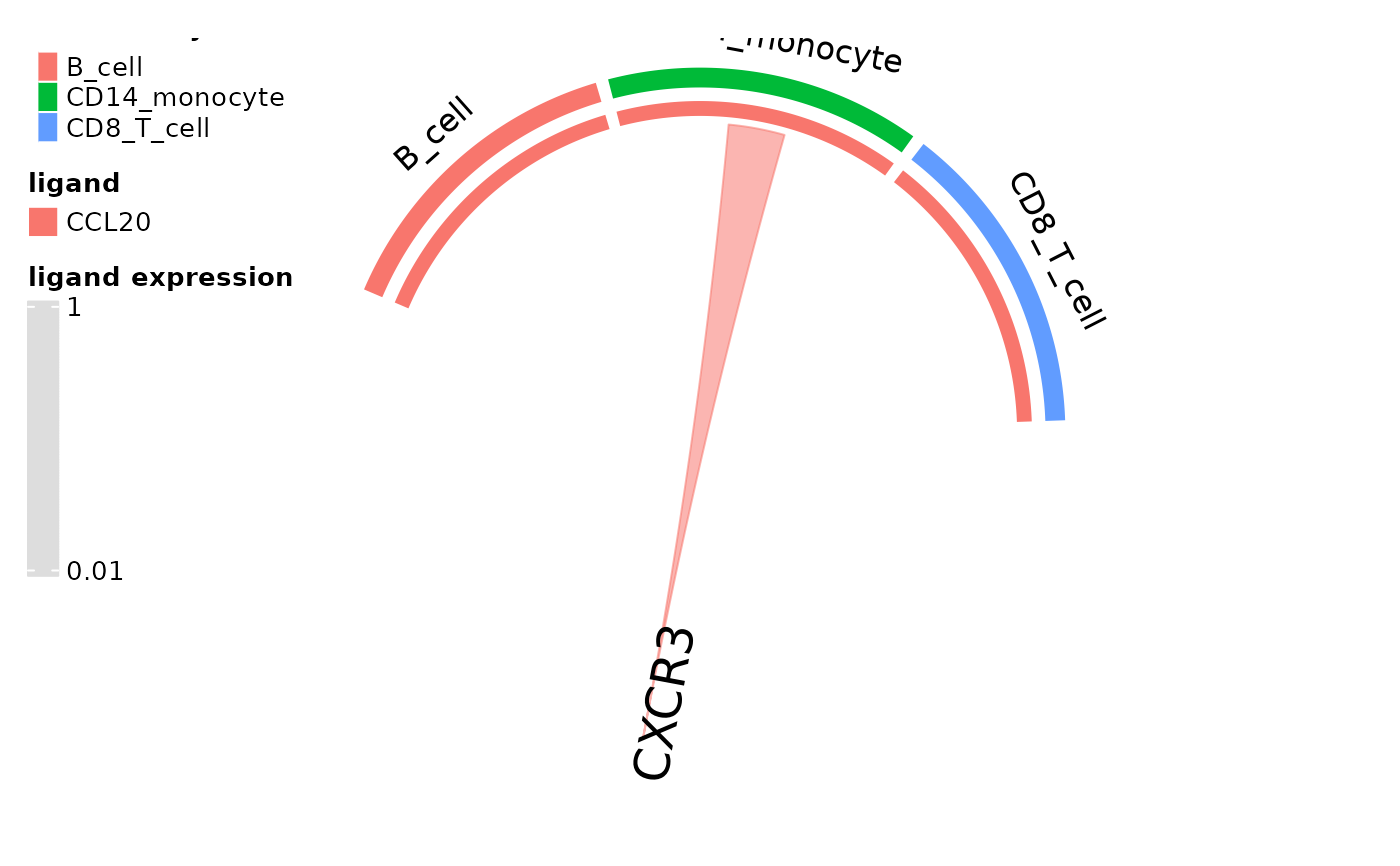
#basic usage
circos_ligand_receptor(pbmc_dom_built_tiny, receptor = "CXCR3")
#> There are more than one numeric columns in the data frame. Take the
#> first two numeric columns and draw the link ends with unequal width.
#>
#> Type `circos.par$message = FALSE` to suppress the message.
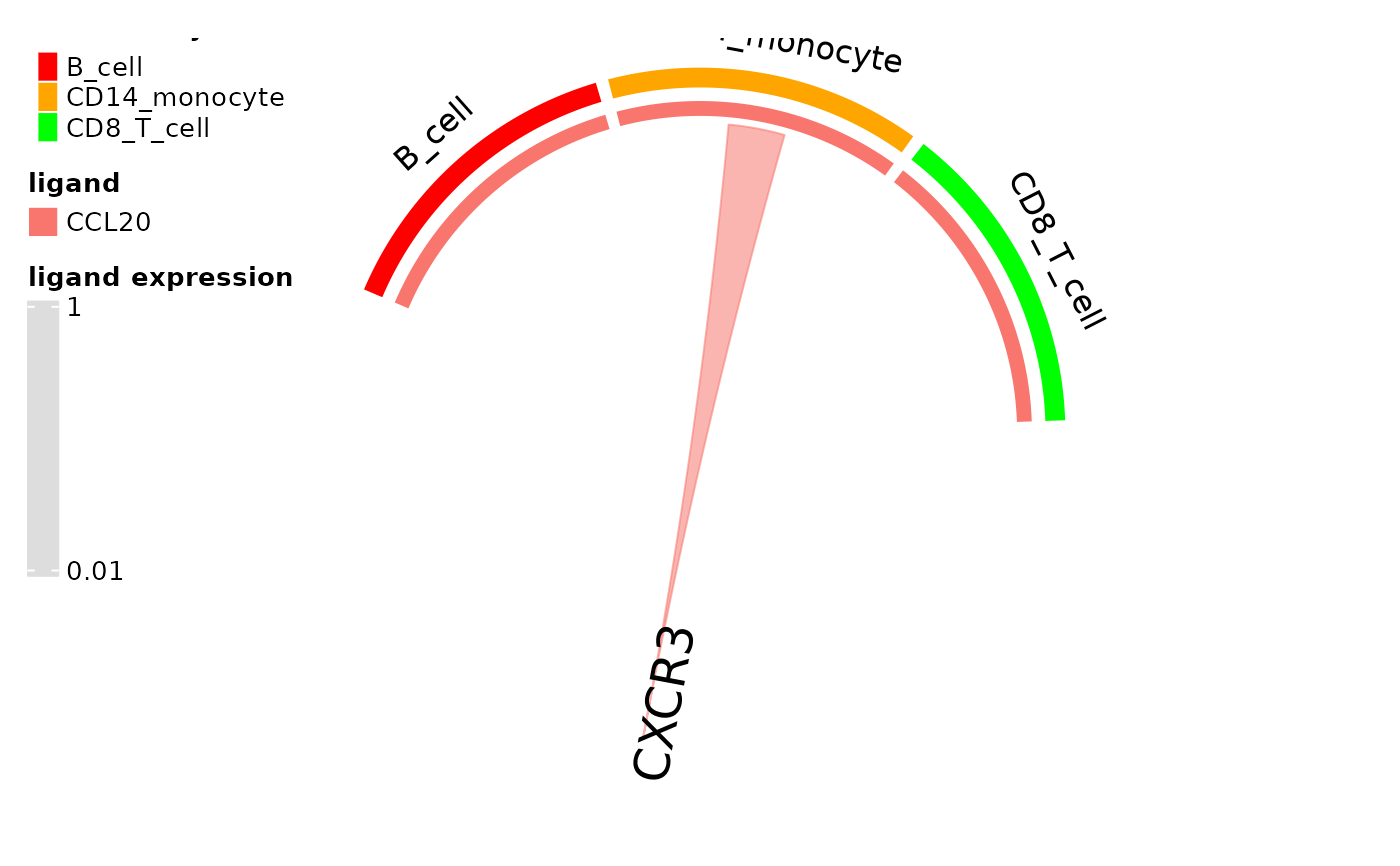
 #specify colors
cols = c("red", "orange", "green")
names(cols) = dom_clusters(pbmc_dom_built_tiny)
circos_ligand_receptor(pbmc_dom_built_tiny, receptor = "CXCR3", cell_colors = cols)
#> There are more than one numeric columns in the data frame. Take the
#> first two numeric columns and draw the link ends with unequal width.
#>
#> Type `circos.par$message = FALSE` to suppress the message.
#specify colors
cols = c("red", "orange", "green")
names(cols) = dom_clusters(pbmc_dom_built_tiny)
circos_ligand_receptor(pbmc_dom_built_tiny, receptor = "CXCR3", cell_colors = cols)
#> There are more than one numeric columns in the data frame. Take the
#> first two numeric columns and draw the link ends with unequal width.
#>
#> Type `circos.par$message = FALSE` to suppress the message.