Creates a heatmap of the signaling network. Alternatively, the network
matrix can be accessed directly in the signaling slot of a domino object using
the dom_signaling() function.
Usage
signaling_heatmap(
  dom,
  clusts = NULL,
  min_thresh = -Inf,
  max_thresh = Inf,
  scale = "none",
  normalize = "none",
  ...
)
Arguments
- dom
domino object with network built (
build_domino())- clusts
vector of clusters to be included. If NULL then all clusters are used.
- min_thresh
minimum signaling threshold for plotting. Defaults to -Inf for no threshold.
- max_thresh
maximum signaling threshold for plotting. Defaults to Inf for no threshold.
- scale
how to scale the values (after thresholding). Options are 'none', 'sqrt' for square root, or 'log' for log10.
- normalize
options to normalize the matrix. Normalization is done after thresholding and scaling. Accepted inputs are 'none' for no normalization, 'rec_norm' to normalize to the maximum value with each receptor cluster, or 'lig_norm' to normalize to the maximum value within each ligand cluster
- ...
other parameters to pass to
ComplexHeatmap::Heatmap()
See also
Heatmap Plotting Functions:
cor_heatmap(),
feat_heatmap(),
incoming_signaling_heatmap()
Examples
example(build_domino, echo = FALSE)
#basic usage
signaling_heatmap(pbmc_dom_built_tiny)
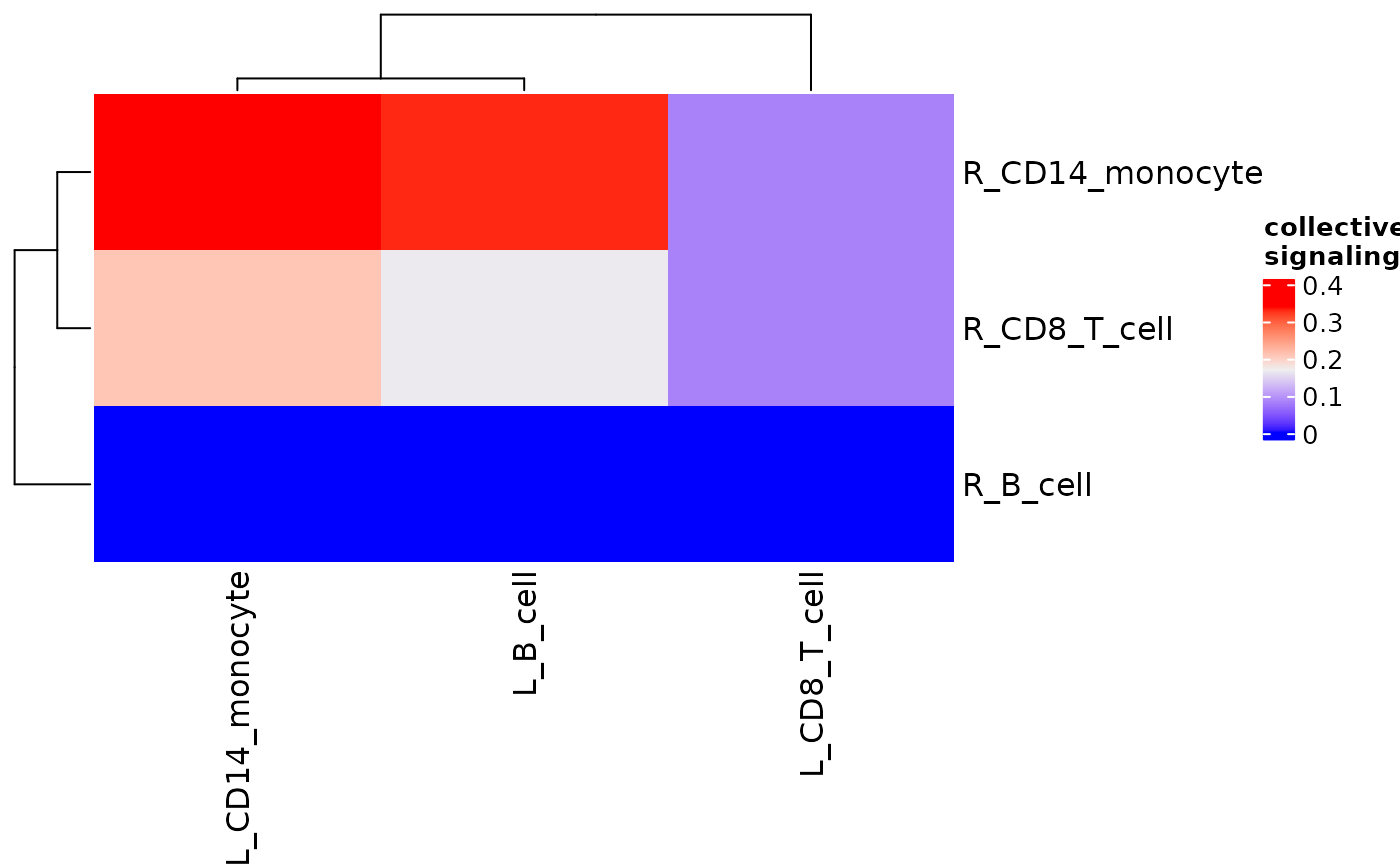 #scale
signaling_heatmap(pbmc_dom_built_tiny, scale = "sqrt")
#scale
signaling_heatmap(pbmc_dom_built_tiny, scale = "sqrt")
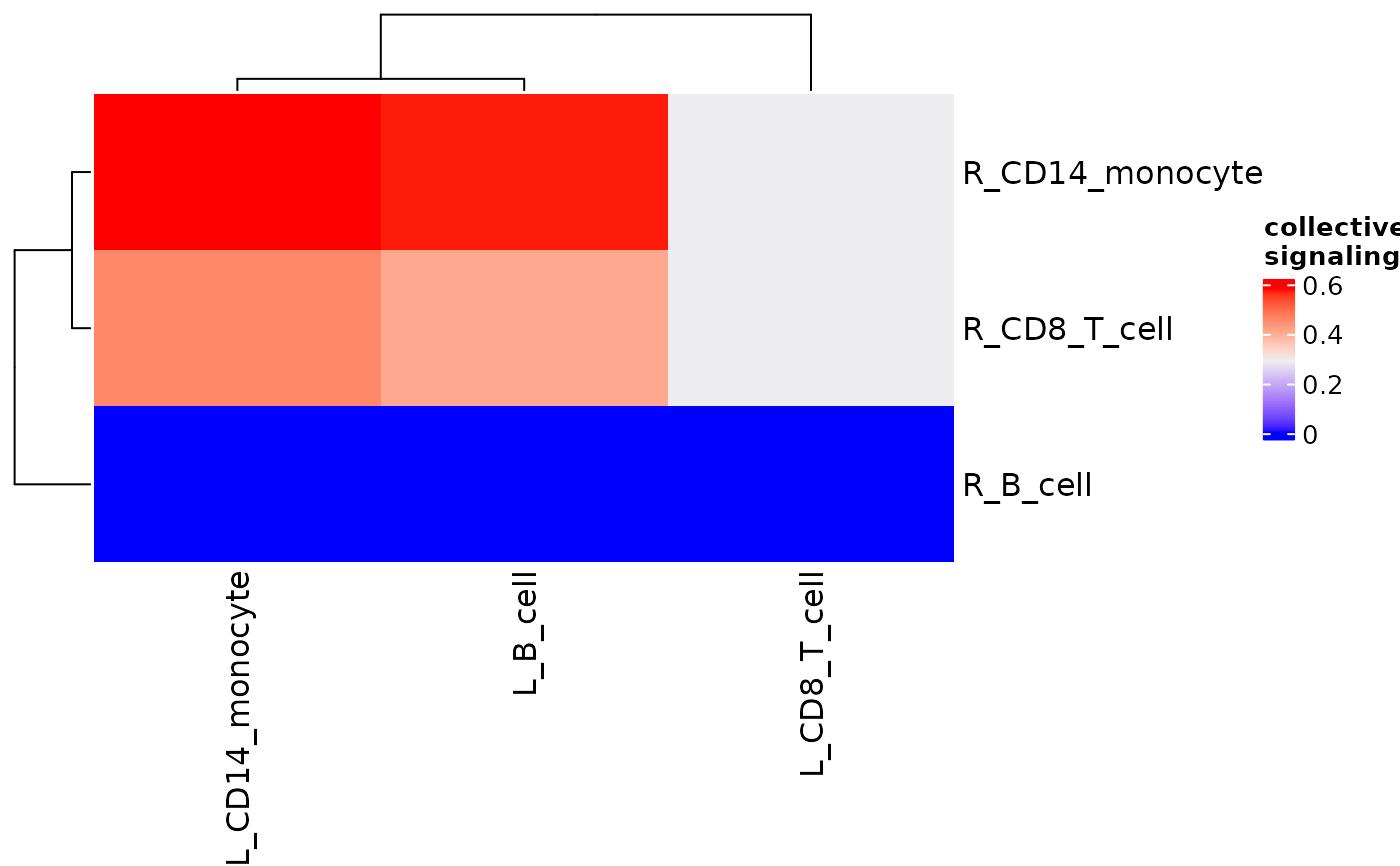 #normalize
signaling_heatmap(pbmc_dom_built_tiny, normalize = "rec_norm")
#> Warning: Some values are NA, replacing with 0s.
#normalize
signaling_heatmap(pbmc_dom_built_tiny, normalize = "rec_norm")
#> Warning: Some values are NA, replacing with 0s.
