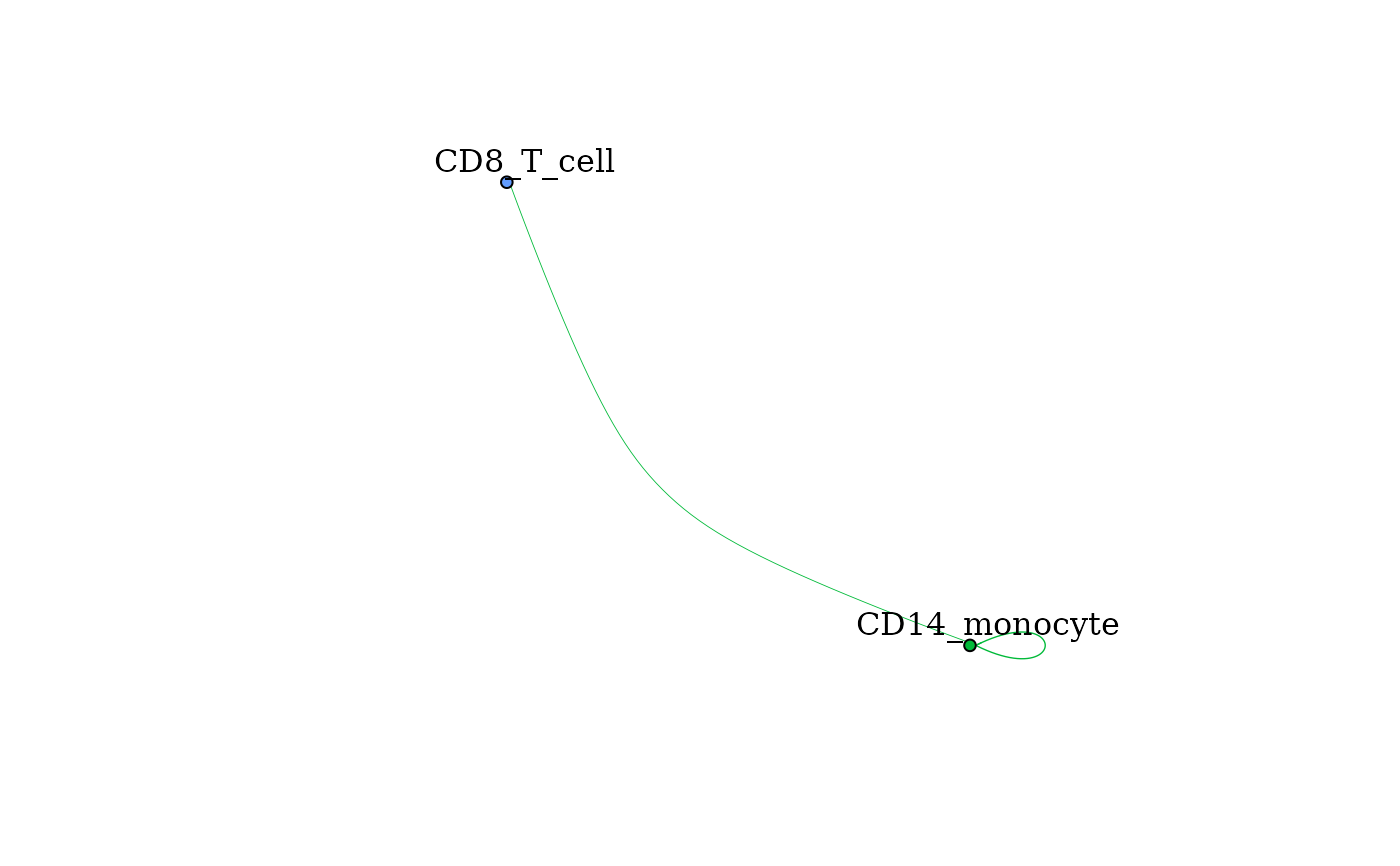
Creates a network diagram of signaling between clusters. Nodes are clusters and directed edges indicate signaling from one cluster to another. Edges are colored based on the color scheme of the ligand expressing cluster
Usage
signaling_network(
  dom,
  cols = NULL,
  edge_weight = 0.3,
  clusts = NULL,
  showOutgoingSignalingClusts = NULL,
  showIncomingSignalingClusts = NULL,
  min_thresh = -Inf,
  max_thresh = Inf,
  normalize = "none",
  scale = "sq",
  layout = "circle",
  scale_by = "rec_sig",
  vert_scale = 3,
  plot_title = NULL,
  ...
)
Arguments
- dom
a domino object with network built (
build_domino())- cols
named vector indicating the colors for clusters. Values are colors and names must match clusters in the domino object. If left as NULL then ggplot colors are generated for the clusters
- edge_weight
weight for determining thickness of edges on plot. Signaling values are multiplied by this value
- clusts
vector of clusters to be included in the network plot
- showOutgoingSignalingClusts
vector of clusters to plot the outgoing signaling from
- showIncomingSignalingClusts
vector of clusters to plot the incoming signaling on
- min_thresh
minimum signaling threshold. Values lower than the threshold will be set to the threshold. Defaults to -Inf for no threshold
- max_thresh
maximum signaling threshold for plotting. Values higher than the threshold will be set to the threshold. Defaults to Inf for no threshold
- normalize
options to normalize the signaling matrix. Accepted inputs are 'none' for no normalization, 'rec_norm' to normalize to the maximum value with each receptor cluster, or 'lig_norm' to normalize to the maximum value within each ligand cluster
- scale
how to scale the values (after thresholding). Options are 'none', 'sqrt' for square root, 'log' for log10, or 'sq' for square
- layout
type of layout to use. Options are 'random', 'sphere', 'circle', 'fr' for Fruchterman-Reingold force directed layout, and 'kk' for Kamada Kawai for directed layout
- scale_by
how to size vertices. Options are 'lig_sig' for summed outgoing signaling, 'rec_sig' for summed incoming signaling, and 'none'. In the former two cases the values are scaled with asinh after summing all incoming or outgoing signaling. Vertices with no incoming/outgoing signaling due to the other parameters are given a size of 0.
- vert_scale
integer used to scale size of vertices with or without variable scaling from scale_by.
- plot_title
text for the plot's title.
- ...
other parameters to be passed to plot when used with an igraph object.
See also
Network Plotting Functions:
gene_network()
Examples
example(build_domino, echo = FALSE)
#basic usage
signaling_network(pbmc_dom_built_tiny, edge_weight = 2)

# scaling, thresholds, layouts, selecting clusters
signaling_network(
 pbmc_dom_built_tiny, showOutgoingSignalingClusts = "CD14_monocyte",
 scale = "none", normalize = "none", layout = "fr", scale_by = "none",
 vert_scale = 5, edge_weight = 2)
# scaling, thresholds, layouts, selecting clusters
signaling_network(
pbmc_dom_built_tiny, showOutgoingSignalingClusts = "CD14_monocyte",
scale = "none", normalize = "none", layout = "fr", scale_by = "none",
vert_scale = 5, edge_weight = 2)